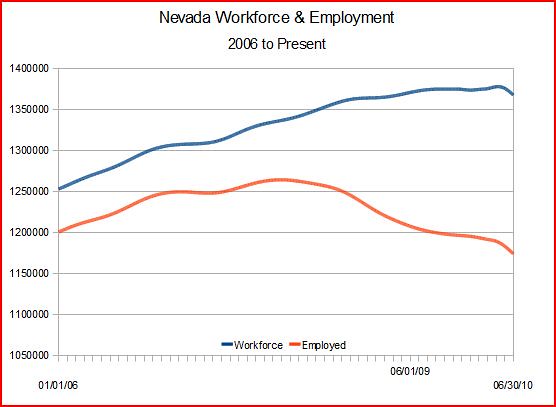
The chart below shows the total number of people available for work (workforce), and the total number of people employed from one month to the next.
Source: Bureau of Labor Statistics
Though the mid 2000’s job creation, expressed by employment, was keeping pace with the rising population. The unemployment rate during this time was within the “normal” range, between 4 and 4.5%. At the beginning of 2006, of the 1.25Million people available for work, 1.20Million were working. It wasn’t until after the banking collapse in 2008, and the resulting recession became apparent, that the rising workforce began to level off. What is of particular interest, is the workforce in the last few months.
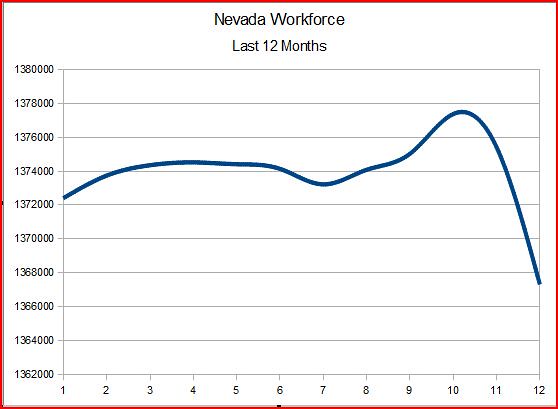
Source: Bureau of Labor Statistics
Although the last month’s figure is only a projection, it shows a significant decrease in the population is expected. The next few months will determine whether or not this is the beginning of a new trend. A decrease in the workforce population, could cause an improving unemployment rate. If that happens, it would be a mistake to believe that a lowering unemployment rate automatically signals an improving economy. A lower rate could be caused simply by people leaving our state to seek work elsewhere.


1 comment:
This is informative. I agree with your interpretation. I am guessing the safety net (supportive social services) in Nevada is relatively scant compared to other states. So once people lose their job and the oportunities dry up, there is little for them to fall back on so they must move.
Post a Comment