Sunday, October 25, 2009

Globalization's Downward Spiral

In 6,000 years of recorded human history there has never been a country, or an empire, that grew strong with a weak monetary system. The fall of empires is always foreshadowed by devaluation; Always. From Byzantines byzant, to Rome's drachma, to England's pound, the deliberate cheapening of the money marks the beginning of the end.

I think of this when I read in the financial press about how the falling dollar is good for exports, a fact that is technically true. They say higher exports will lead to recovery because of the global market. Countries are in a race to out-export each other, and we have to compete. Meanwhile, the working poor and lower middle class see the price of bread and shoes rise, and wonder why.

To his credit, Donald Luskin at least mentions the working poor, if only in passing.
It doesn’t take a genius to figure out the winners and losers on this score. If you buy cheap Chinese-made goods at Walmart, you’re going to be a loser. Prices are going up.

The fact is that with a sinking dollar everybody loses, the Walmart shoppers are only the first in line. This isn't just a screed for the bleeding heart liberals either. The ability of the working poor to acquire necessities is the foundation on which all else is built. When the poor go without, the middle class lose their jobs, and then who's shopping at Walmart?

And there's no safe haven in the booming stock market either. As Luskin himself points out:
This year’s 15 percent dollar drop began on March 9, the very day the stock market found its bottom. Tick for tick, the dollar’s decline has tracked the stock market’s monster rally.

But it's not a sign of recovery as Luskin concludes. Like gamblers who only talk of their winnings, the bulls on Wall Street never mention the 15% haircut. For them, the rise pads the bottom line, and the government gets to claim credit for improving conditions. Statistics are about quantity, not quality.

On our current trajectory, the dollar will hit an historic low sometime around Christmas. My guess is, they'll blame the lack of retail sales on consumers.

Tuesday, October 20, 2009

Development In The Public Eye

Another October, time for me and my brother Steve to make our annual pilgrimage to Laguna Seca Raceway for the American Le Mans Series
(ALMS)
4 hour endurance race in Monterrey, California. The series usually features 4 classes of cars, 2 prototype (experimental) and 2 production (street cars). Recently they added a 5Th, the Michelin Green X Challenge.

All of the Green X cars run on bio fuel and are the most experimental of the prototypes. The one that I was most impressed with was the Dyson Lola/Mazda turbo-diesel hybrid.
Dyson Mazda

Dyson Racing started as a father/son team over 25 years ago and has been a major independent in the ALMS since 1999. The father is now retired. They run 2 cars but the white and green #16 caught my eye at the 2 hour mark, when we were sitting in turn 4. He was going nose to tail with eventual winner Gil De Ferran in his more powerful Jim Hall Acura. De Ferran should have been losing him in the straights, but wasn't. At about 2 1/2 hours into the race, the Dyson team had a lengthy pit stop which put them out of the top ten.

We arrived early, in time for the morning warm-ups and spent some time wandering around in the pits. I didn't shoot a lot of video as I wanted to save the battery for the race. One shot I couldn't pass up was a close-up of De Ferran checking the seating arrangements in his Acura. Another shot was an exhibit of vintage Jim Hall Chevy Chaparrals from the old Can-Am series. There were a lot of exhibits explaining some of the new technologies, and of course, the inevitable t-shirt booths and $3 hot dogs too.

Shooting video of auto racing is not easy. I was battling fences all day long. There were some holes in the fence to shoot through, but these were always crowded with photographers. The hilly terrain sometimes helped. One guy I saw was carrying a small aluminum step stool and shooting over the fence. Great idea, I'll have to remember that for next time.

We watched the start of the race at turn 2, the fastest part of the track. After about an hour we moved to turn 6, then to turn 4. We stopped by turn 10 on our way to the "corkscrew", a series of corners starting with a 90 degree left hander, then a 90 degree right hander and a sweeping left hander all happening in a 3 story drop in elevation. We finished up back at turn 2. It was a great day, and a great race.

Saturday, October 17, 2009

The Common Knowledge Pool

Dr. Elinor Ostrom became the first woman to win the Nobel Prize in Economics this week. Her selection was somewhat controversial, not because she's a woman, but because her nearly 60 years of field work and research challenge the left/right political and economic establishments. Her work centers around the Common Pool Resource, a condition where a resource is neither regulated by government nor privately owned, and seems to refute some long held assumptions. The implications of her research are widespread and far-reaching, and include the future of the internet. To understand how, let's first travel back to Merry Old England.

Before there was such a thing as economics, the Lords of England allowed the peasants a certain amount of grassland on which to feed their livestock. Not wanting to sully themselves with petty squabbles, the Lords left the management of the commons to the peasants. Self-interest soon took over in the form of overgrazing, and what had been a growing prosperity turned into poverty. This “Tragedy of the Commons” has been accepted wisdom for both Adam Smith's theories on the free market and Thomas Hobbes's regulatory Leviathan. The argument between privatization and regulation assumes the tragedy as a given.

As a student at UCLA in the mid 1950's, Elinor Ostrom became involved in California's water wars. The rising population after World War II was causing a decrease in the water table in the Los Angeles basin. Seawater from the nearby Pacific Ocean was contaminating the city's drinking water. Her interest was not so much in one solution or another, but in how the disparate groups of people came together and organized themselves to find a solution. This led to a lifetime of study in the common pool resource.

Together with her husband, she co-founded the Workshop in Political Theory and Policy Analysis at Indiana University, an inter-disciplinary group to research some basic questions. Do we need a central authority to manage resources? Is tragedy the necessary outcome of the commons? From forests and fishing grounds, to inner cities Dr. Olstrom’s group has found that with communication among participants and self policing, common pool resources can reach efficiency levels equal or better (92%) than either government regulated or privately owned resources.

In today’s technological world, one common field is the internet and knowledge is the common resource. Knowledge can be privately owned in the form of subscription services and regulation is a constant threat. Part of what Dr. Ostrom’s work shows is that it is not enough to simply use the internet. Active participation is key to keeping the internet free. Self policing, calling out abusers, is also important. As Thomas Jefferson said, an informed citizenry is fundamental to a free people. There’s a lot at stake here and the choices are ours. The ideas of Elinor Ostrom are a big deal for us commoners and her Nobel Prize is well deserved.

Articles written by two of her former students can be found here and here. Her press conference can be found here. It runs 23 minutes.

Tuesday, October 13, 2009

Traditional Media Win The So-What Prize

Now that the who-haw over President Obama's winning of the Nobel Peace Prize is subsiding, was the story really that big of a deal? Is it so big that the traditional media needs to spend the better part of a week on it? It seems everyone is trying to find some greater meaning from a mostly meaningless prize. Was this really news, or a manifestation of the herd mentality? OK, so he hasn't really done anything to deserve it. So what? It's their prize, they can give it to anyone they want to, and for any reason.

Meanwhile over in the blogosphere, Zero Hedge has been doing some excellent investigative reporting on the near criminal enterprise that Goldman Sachs has become, not just robbing the small investor with their HFT computer system, but mutual fund managers as well. Rob Kirby at Financial Sense has been reporting on the downright bizarre happenings in the precious metals and Treasury Bill markets, and then there's this; Dr. Carsten Mundt of Kangaroo Tail charts the S&P 500. In a normal market, the P/E Ratio should top out at about 20.

sp500-pe-ratio-10-6-09

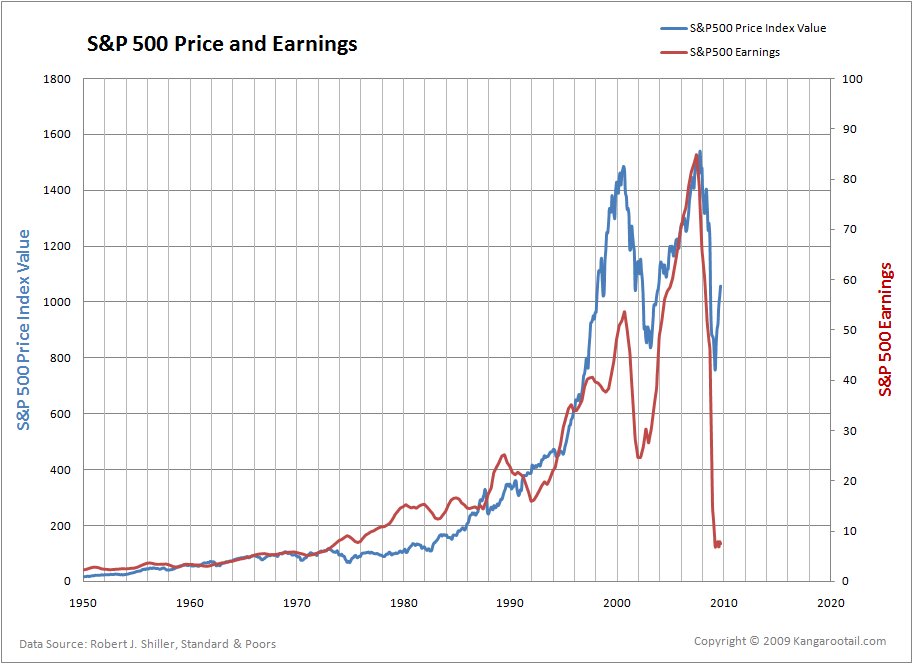
Compare the solid prosperity of the 1950's with where we are today. Compare the Reagan boom years of the 1980's, the so-called "Decade of Greed", with where we are today. Does it look like everything is going to be fine, or would you say that something has gone terribly wrong? This booming market has nothing to do with company profits. In the next chart, the red line shows the earnings of the 500 companies.

sp500-price-and-earnings-10-6-09

As a final point, in case you might think these things don't affect you, here's what the value of the money in your wallet has been doing since the beginning of the year. Note that the fall in the dollar started in March, the same month that the "recovery" supposedly began.

dxy ytd

It wasn't so long ago that the traditional media was full of stories about bankrupt newspapers and plunging TV ratings. It's a subject they'll no doubt be returning to in the future.

Tuesday, October 6, 2009

The Economic Workshop At UNR (Part 2 of 2)

The REAP and BEA websites offer a wealth of regional information and both encourage republication of their data, tables and charts.

The Regional Economic Analysis Project (REAP) is the brainchild of retired professor Gary Smith of Washington State University. Along with the charts and tables, REAP includes analysis on what things mean, and just as important, what they don’t mean. Just poking around on it, I found several cautionary tales of other numbers to check before reaching a conclusion. Being the work of a former professor, REAP is as much a teaching tool as a source of information. The site is arranged by state, county, and regions (groups of counties).

From the main page, click on Nevada. This brings you to a drop down menu of economic categories, and after choosing one, you get a list on the right of counties and regions. Here's the per capita income of Washoe County. It has the added bonus of showing inflation. The blue line shows actual dollars while the red line shows inflation adjusted dollars (buying power).

inflation washoe

Here's our region showing Washoe, Carson, Story, and Douglas Counties. The numbers are slightly different, but the trends are the same.

western nevada inflation

This chart shows the earnings per job in Washoe County and Nevada. 100% is the national average and is used as the baseline. This chart comes with a cautionary tale. Since it measures both full and part-time employment, sometimes a rise in part-time jobs can cause a decrease in the overall average. One would have to look through the employment numbers before reaching a conclusion.

percent earnings

There are ways to combine the charts and tables, but I'm still just poking around here. Did I mention I take lousy notes? Luckily, there are instructions, and Dr. Smith is happy to help.

Alison Adam heads up the Bureau of Economic Analysis website. She was at the workshop to explain the new inter-active features. From the main page, click on Regional and then quick links. This brings you to the inter-active menu. At the bottom is Local Area Personal Income and Employment. Click on charts and that brings you to a design-your-own section. Again, just poking around to see what I could find, I made this one.

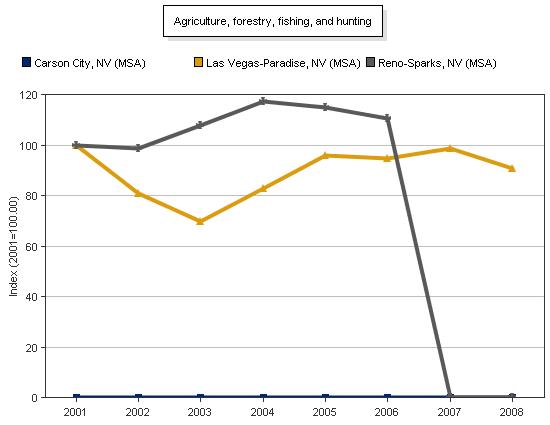
bea agriculture

Although the chart is labeled Agriculture, Forestry, Hunting and Fishing, we can rule out the last three and focus on agriculture within city limits. Whether this chart shows the disappearance of open space in the south meadows or ranch land in the north valleys would take some research. But, seeing as how that disappearance happened right at the top of the real estate boom, one thing we can say with absolute certainty is - Mama didn't raise no fool out there on the farm!

Both of these websites are a gold mine of local information from credible, unbiased sources. The entire experience of the workshop seems to me the way things ought to be; a university offering knowledgeable, experienced speakers to anyone who wants to listen, a government department genuinely interested in providing useful information to the people, and a retired professor taking it upon himself to educate the general public. It was a very positive experience all around.

Monday, October 5, 2009

The Economic Workshop At UNR (Part 1 of 2)

On Tuesday I attended the “Navigating Nevada’s Economy Workshop” hosted by UNR. As far as I could tell, with the exception of a UNR camera crew who stopped by for a quick interview, I was the only member of the media present. Too bad, the workshop offered a powerhouse line-up of speakers from both government and academia focusing on our area’s economy. Economists, teachers, and computer programmers from the Bureau of Economic Analysis
(BEA)
and the Regional Economic Analysis Project (REAP) combined to explain how data is collected, the analysis of that data, and how their websites are arranged. Both websites are inter-active and look to be very useful to anyone, in or out of government, interested in our local economy. Apparently, the local traditional media isn’t that interested.

Two big idea’s I came away with from the workshop were the problems and solutions to understanding an economic region. The other idea that was unstated, but occurred to me later, was the disconnect between economists and the media.

Data can only be collected by city, county, and state, but no-one in the public makes decisions based on lines on a map. Gary Smith, a retired professor from Washington State University and the driving force behind REAP, introduced the idea of “the State of Sierra.” In order to understand economic numbers, one has to take into account the fact that people travel. This is not just true with tourism. We might live in one town and work in another, crossing city, county, and state lines, producing and spending along the way. Simply looking at Reno’s numbers will only tell you so much about Reno’s economy. In order to reach an understanding, one has to look beyond Reno. I’ll explain more about this in Part 2 where I will attempt to demonstrate the REAP and BEA inter-active websites.

After I got home and was mentally digesting all that I had seen and heard, I started thinking about 2 things. One was Rob Brown’s presentation about the timeline in which economic data is received. The other was Mallory Rahe’s demonstration of using economic data to tell a story.

From time to time one can find stories in the press of inaccurate government figures or “inept unelected bureaucrats”. I’ll admit, taking shots at the government can be great fun, and more importantly one of the things that insures a free and independent press. However, when it comes to government revisions of economic numbers, it’s important to know the timeline by which the numbers are gathered in order to tell the story with any degree of accuracy. For instance, home foreclosures are known quantities within a month, but personal income is received via the IRS and is from the previous year. Information becomes more accurate as the information is gathered. Economists have to arrive at some initial conclusions using estimates sometimes derived by inference. It is only over time that hard data becomes available and estimates become known quantities. This is not only critical to telling an accurate story, but also in separating the truth from political cheerleading.

I could go on about other presentations, the RIMS II program which helps gauge the economic impacts of proposed developments, Dr. Keith Schwer‘s extensive study of Nevada and why he believes our state will lag behind in any recovery, an inside look at the Federal Reserve from a Fed economist, and general discussions of methodology. The depth of knowledge by each of the speakers was truly impressive. This was my second workshop at UNR within the last year and both were excellent - well worth the time, effort, and expense. Tomorrow we’ll look at some of the features of the REAP and BEA websites.