I've probably written nearly 5,000 words about my sister since her death three weeks ago. That's a lot for me. Most have been edited out.
After I wrote a remembrance for
This is Reno, it was decided that she would have wanted a church service. People thought I would just read what I had already written. The problem was that I had written that to describe my sister to people who hadn't known her. Besides which, how things read and how they sound are two different things. I decided to write another one.
The Bishop of the church liked it so much that he asked me to send him a copy. He thought it might help someone else in a similar situation someday. I also sent him some thoughts on how I went about writing it. Maybe that will help somebody too. Since it's all I've been doing for nearly a month, I guess it all qualifies as a blog post. It's not the happiest subject, I know.
Anyway, what started as a stroll down memory lane turned into a marathon. I'm mentally and emotionally drained. I'm beginning to wonder if what had once been cathartic is now turning into something less clinically healthy. So, this will be the last of it. It's time to catch up on the news, rejoin the world, find a new subject and get back in the game.
How I wrote my remarks for a funeralI can give you any number of reasons why I’m not a good choice to speak at a funeral. But when my sister died, and it was decided that she would have wanted a church service, I was the logical choice to speak for the family. In spite of my many misgivings about the idea, I knew in my heart it was the right thing to do. But it raised one very big question in my mind; Now what?
I’ve been writing on the internet for the past few years as a hobby and there are three simple rules I use when I write:
1) Tell them something they don’t already know.
2) You may know it all, but you don’t have to say it all.
3) To thine own self, be true.
There are two kinds of people at a funeral; family and friends. Most people in the family already know most of the stories. But friends are different. People move a lot, and friendships come and go. If you think about it, we really don’t know our friends very well. What seems old news to a family member will be unknown to a friend.
Think about your own friends. What’s the picture they have in their living rooms. Is it just a nice picture or is it something significant to them? How about that old picture in the hallway? What about the little statue in the bookcase? There are a thousand details of a person’s life that never come up in conversation, even with their closest friends. In my sister’s case, she had only known her friends for 2 or 3 years. She was 65 when she died. That left me with a lot of memories to work with.
That’s where you come in. You can give them perspective. You can help them see that their time and effort spent developing their friendship wasn’t wasted. Their friend was a genuinely good person and they are better for having known them. Let them see for themselves that they made a wise choice.
I started by making a list. Some of the memories weren’t pleasant, and a couple were personally embarrassing, but I wrote them down anyway. You never know what you’re going to use, and besides, one memory leads to another. Above all, stick to your own memories. Family stories can be entertaining, but personal recollections will be the most significant.
A partial list of what I ended up using would have looked like this:
Coloring book
Portrait painting
The Beatles
Drivers license
When you have 10 or 15 memories on your list you’ll see a pattern emerge; a group of stories that have something in common. You will probably see more than one group. You can expand each memory you want to use by answering a few questions. Where were we? Why were we there? What did I see? What did I hear? What did I think/feel about it at the time? What do I think/feel about it now?
Not all of your answers will be important. What you heard may be more central than what you saw. Focus on the important aspects. Some memories will only be a single sentence. Things in the scene are only the mechanics. How the experience affected you, how you felt, and why you remember it is the goal.
In my case, I had always known my sister liked to paint. Until I started a list of memories, I hadn’t realized how important it was to her. What was especially enlightening was the effect her love of art had on me. When you make your list, you will probably have a similar experience and the writing will come easier.
A little embellishment can often make a story better, more important or funnier than it really was, but in this case it’s completely unnecessary. The mere fact that you remember what happened establishes its importance. Your fondest memory could be something like the time the two of you sat on the beach, watching the waves and talking about nothing. Chances are, some friends will have had a similar experience. Real life is not like a James Bond movie. Just tell them what happened.
So, how did it all go?
I’m still not completely happy with what I wrote. There are the usual amount of grammatical errors, several paragraphs could easily be rewritten, and there’s no real conclusion at the end. I forgot a few lines and mangled a few others. I purposely skipped one as I didn’t think I could say it without crying. My voice was shaky and I had to stop a few times to gather my emotions. None of that mattered.
Afterwards, several of Karen’s friends thanked me for telling them my memories of her. I had confirmed in their minds the basic decency of the friend they used to know. The Bishop liked it so much that he asked me for a copy as an example for other people in a similar situation. I left the church that day feeling like I had done some good, and that Karen would have been proud of me for it.
Karen loved her friends and she loved her family. We loved her too. On the day of her funeral, nothing else mattered.
Memories of my sister, delivered at Murphy's Ward Church April 3, 2012I’m Ron, one of Karen’s brothers. I’d like to tell you a little bit about growing up with Karen.
One of the oldest memories I have of anything, I had to have been three years old, so Karen would have been ten. We were sitting on the floor and we had our coloring books out. Karen was showing me how to color inside the lines. All the pictures in Karen’s coloring book were perfect. All the colors were even and just the colors they were supposed to be. Each one looked like a real picture. She used bright colors and had a light touch. Karen was great at coloring.
Not long after that Karen asked me if I would sit for her so she could paint my portrait. I didn’t know what a portrait was. She got out one of her books and showed me some pictures of kings, and presidents, and other famous people. I tried several poses, trying my best to look like one of the famous guys I had seen. She finally told me that the best thing to do would be for me to just sit there and be myself.
That was about the time she told me about impressionism; Van Gogh and Monet, and the rest. It turned out, you really don‘t have to color inside the lines all the time. It was OK to express yourself, show some emotion, let your spirit out. I came to understand that staying inside the lines makes a nice picture, going outside the lines can be messy, but if you do it right, it can work out pretty good.
I came to understand the proper role of the artist, to look for beauty and find meaning as a way of connecting with other people so that they could see it too. I also came to understand that you really don’t need to be an artist to do any of those things. Seeing beauty, finding meaning, and connecting with people are not so much something you do, as something you let happen. As I think back on those years, Karen taught me a lot.
She used to let me tag along with her and her friends fairly often. She’d take me to her the high school’s football games even though she couldn’t stand football. She took me to basketball games too, even though she never liked basketball either. Karen even let me tag along when she and her friends went to see the Beatles at Candlestick Park. I was probably the only ten year old boy in the whole place.
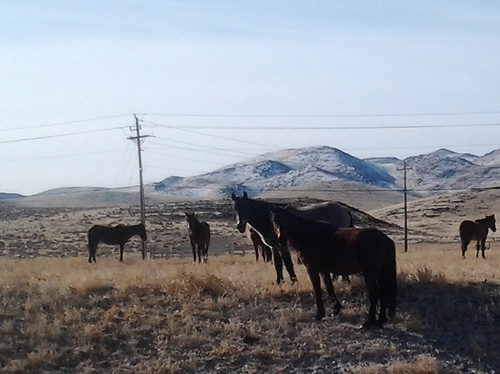
When I got my learning permit to drive a car, Karen would make up places she needed to go and then talk mom into letting me drive her there. As soon as we got in the car, she’d admit that she really didn’t need to go anywhere. We’d drive out to the reservoir and feed the ducks, or out to the stables to look at the horses.
Most of my memories of Karen in one way or another involve horses. Karen had a unique connection to horses that went beyond a little girl’s romanticism. Like anyone with a long term illness, Karen’s diabetes wasn’t just a fight for physical survival. It was also a battle of the spirit. For many years, horses were a kind of spiritual ally. She was always happiest whenever she was around them.
She could always see the beauty in horses, and from there I guess, find some meaning and reconnect. As I think back on those years, whenever we went riding, or were just visiting the horses, I could talk to Karen about anything.
Of course, there was every logical reason not to go horseback riding with Karen. Even she admitted that her horses were not particularly well trained. She just didn’t have the energy for it. The combination of greenhorn riders and unruly horses is, if not dangerous, at the very least, adventurous.
The very first time I rode one of Karen’s horses, I ended up face down in the mud. . Next to the stable was this big empty pasture, so we got out there and Karen says, “OK. Hop on.“ So I got on and the horse took off running. I don’t know if it was a full gallop, but it was a lot faster than I wanted to go.
Karen hadn’t tightened the saddle strap quite tight enough and the saddle started slipping. She didn’t have a lot of practical experience back then. Karen was yelling, “Pull back on the reins! Pull back on the reins!” It was something I would hear her say many times in the years to come.
As the horse continued to run and the saddle continued to slip, I decided it was time to bail out. I thought that trying to hit the ground running would be a good idea, but it didn’t work. My feet hit the ground but after a step or two I pitched forward into a sliding faceplant through the mud.
As I was laying there slowly regaining my senses, the first thing I remember is the sound of Karen’s laughter. She thought the sight of her kid brother taking a nose dive was hysterically funny. I didn’t appreciate that sound at that moment, but I’m glad now that I heard it then. Of all the times I heard Karen laugh, I remember that time the best.
As Karen’s health deteriorated, it got to the point where she couldn’t go riding anymore.
Her eyesight was so bad she had to give up painting. Karen grew more serious. She hardly ever laughed anymore, at least not like she used to. Our conversations became short. Karen and I hardly spoke at all. We’d see each other at the holidays and an occasional birthday. We almost never called each other. That was as much my problems as hers
Eventually, they (Karen and Marv) came here, to this church, and the effect was immediate. Everyone in the family witnessed it. One night the phone rang and the voice on the other end said, “Hi. How ya doin’?”
Is this Karen?
She started laughing. It was the old laugh. “Yea, who did you think it was?” Then we both started laughing. We talked about art, and llama’s, and job prospects, and politics, and God, and girls, and pot-bellied pigs, and Monet…
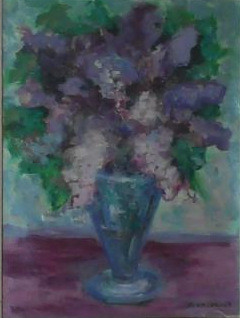
Flowers and Vase by K. ANDERSEN