Saturday, July 31, 2010

Nevada’s workforce deflation

The Bureau of Labor Statistics (BLS) released their projected unemployment numbers for June 2010 yesterday. The 0.02% rise in unemployment to 14.2% no doubt caused some anguish in Carson City. The BLS stat sheet also included total workforce, total employment, and total unemployed. By looking at some of these other numbers, another story appears.

The chart below shows the total number of people available for work (workforce), and the total number of people employed from one month to the next.

w-e 2006 to present
Source: Bureau of Labor Statistics

Though the mid 2000’s job creation, expressed by employment, was keeping pace with the rising population. The unemployment rate during this time was within the “normal” range, between 4 and 4.5%. At the beginning of 2006, of the 1.25Million people available for work, 1.20Million were working. It wasn’t until after the banking collapse in 2008, and the resulting recession became apparent, that the rising workforce began to level off. What is of particular interest, is the workforce in the last few months.

Workforce 12 months
Source: Bureau of Labor Statistics

Although the last month’s figure is only a projection, it shows a significant decrease in the population is expected. The next few months will determine whether or not this is the beginning of a new trend. A decrease in the workforce population, could cause an improving unemployment rate. If that happens, it would be a mistake to believe that a lowering unemployment rate automatically signals an improving economy. A lower rate could be caused simply by people leaving our state to seek work elsewhere.

Thursday, July 22, 2010

Saving the dollar

There is quite a lot in the financial press these days about whether our government should be piling up more debt or cutting expenses. It’s all politically motivated, and therefore as a matter of economics, is safe to ignore. This chart showing congressional spending demonstrates why.

congressional spending
Courtesy Pajamas Media.

One would not be going out on a limb to say no matter who wins in November, our congress will be spending more in the future.

Of greater importance is the inflation/deflation debate. It’s a near certainty that we are about to get a massive dose of one or the other. The debate is about which one it will be. There are good arguments on both sides, but both often suffer from the same problem; archaic definitions of money. From the Free Dictionary website (italics mine):

Inflation…an increase in available currency and credit beyond the proportion of available goods and services.

Deflation…a persistent increase in the purchasing power of money because of a reduction in available currency and credit.


Both terms assume that currency and credit are two different things; a condition that has not been true since June 24, 1968, the last day a Silver Certificate was redeemable in coin or bullion. From then on, the Federal Reserve Note currency has only been a form of credit.

silver certificate
Silver Certificate, courtesy Wikipedia.

As world currency’s become increasingly cheaper due to globalization‘s emphasis on exports, and sovereign debt obligations turn into a Keynesian nightmare, the current system of “faith based currencies” appears to be reaching its final solution. A global standard, if not a global currency, is the next logical step. With gold prices too high for practical everyday use, a silver standard would make more sense.

At today’s prices, a $5 silver coin would be roughly the size of a quarter. Silver Certificates could be reissued and redeemable at any bank. With a stable price for the dollar, the U.S. just might remain the world’s currency of last resort.

Tuesday, July 13, 2010

How to build a corporate state using a simple yield curve

In a strange twist of fate, I've begun to cheer for the Democrats. My thinking is that the faster they build their progressive utopia, the sooner rational people will see it for the Orwellian nightmare that it is. Many Republicans believe this is already happening, and all will be well in November. I believe it will take longer, mainly because the Republicans seem to be helping them.

Just to make sure we're all starting on the same page, here's a quick and easy explanation of the yield curve.

textbook yield curve
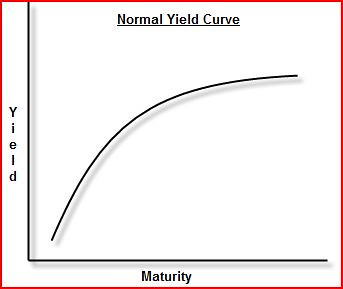
The maturity on the bottom is the time element. The yield is the promised return on the investment. The longer the time, the greater the risk, and therefore, the higher the return. You don't need to calculate the yield to understand the curve. I told you it was easy.

There's a terrific animated chart on stockcharts.com that compares the yield curve on government bonds with the S&P 500. The last 8 years provide a good demonstration of the yield curve's importance. I can't bring the animation here, but the site encourages people to take screenshots. And, now that I've successfully navigated the Microsoft labyrinth and found the magic snipping tool, we can look at some.


yeild curve-sp 702
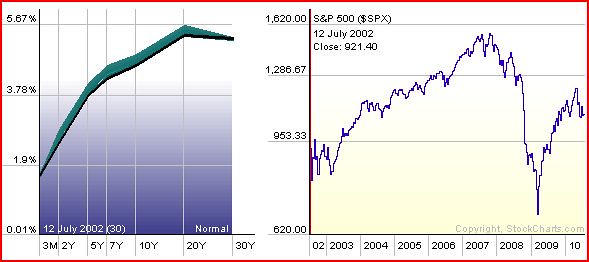
We start our latest round of corporate-nation building in mid July of 2002. On the left, the black line is the yield curve, and the gray areas show the movement and velocity. At this time, the yield curve is in near perfect formation. The chart on the right is the S&P 500. We can see that in 2002, the S&P was just bumping along in no particular direction. Short term investors were having a hard time outguessing which way it would go, and long term investors weren't making anything. Nobody was happy. Stability breeds boredom.


yeild curve mid 03
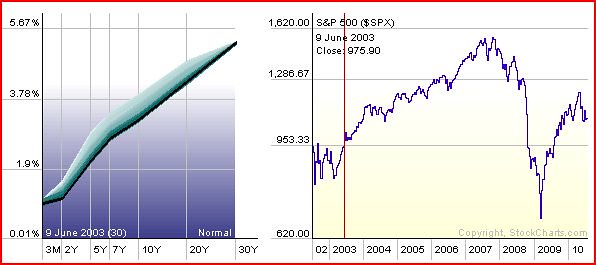
June of 2003: In an effort to get things moving, the Federal Reserve steps in and lowers short term interest rates (dropping the yield). This causes investors to move their money from treasury bills and other short term bonds into the stock market. The S&P hits new highs, and the rally is on. Long term rates remain the same to help home buyers. This move was wildly applauded by nearly everyone at the time.


yeild curve 05
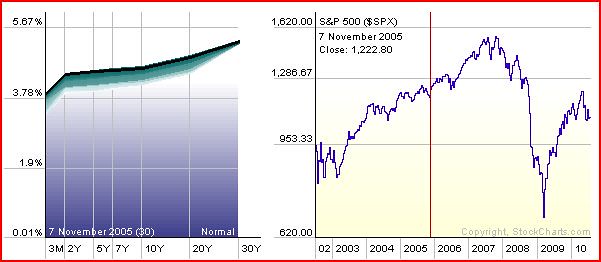
November of 2005: With the rally sustained, the Fed raises short term interest rates. They do this to prevent what Alan Greenspan once dubbed "irrational exuberance". Having started the rally, they now try to dampen the enthusiasm for it. On the S&P chart, notice the stair step nature of the upward momentum, with double and triple peaks followed by minor sell-offs. Each incremental increase in rates by the Fed causes a few investors to exit the stock market. A general upward trend continues as Keynes' "animal spirits" are still in the majority.


yeild curve 06 flat
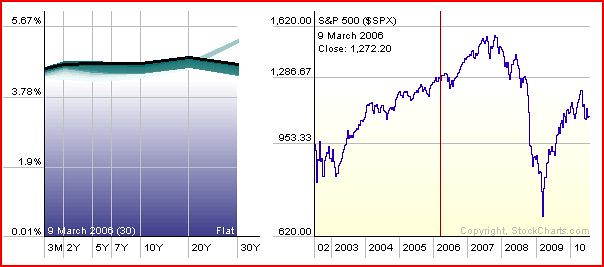
March of 2006: The first sign of trouble, the yield curve turns flat. It's generally considered to be a precursor of an economic transition. Still, it's only one negative sign in a field of positives. The rally continues.


yeild curve inverted 06
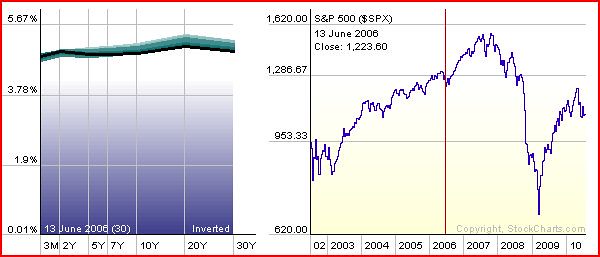
June of 2006: An ominous sign. The yield curve is now inverted with short term yields paying more than longer term yields. The previous 6 recessions were preceded by an inverted yield curve. "Not to worry", say the talking heads, "we've had inversions without recessions, and recessions without inversions before. 6 straight doesn't necessarily mean there will be a 7th." They're right, of course, it doesn't. In fact, the longer a trend is, the less likely it will continue.


second inversion
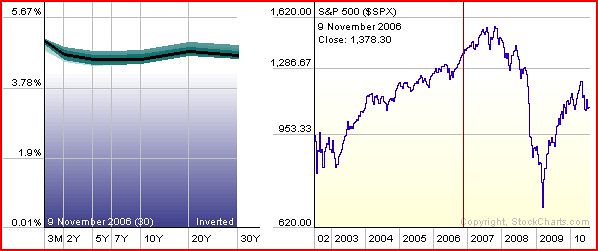
November of 2006: The yield curve flattens and inverts again. This time, it's more pronounced and unmistakable. Talk in the press of an impending recession becomes more numerous. The "doom and gloom" forecasters are largely ignored.


yeild curve double peak
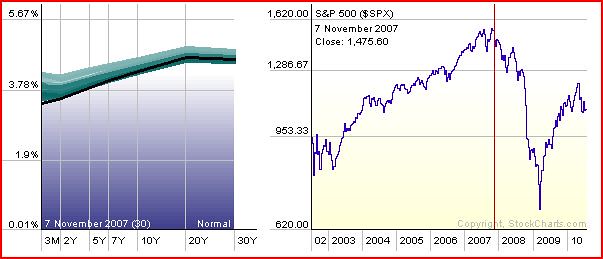
November of 2007: The S&P 500 is at the tail end of a major double peak formation, suggesting the years-long rally has lost its momentum. The Fed begins lowering interest rates to keep the rally going, or at the very least, produce a "soft landing." With short term yields still relatively high, the smart money exits the stock market.


yeild curve before the fall
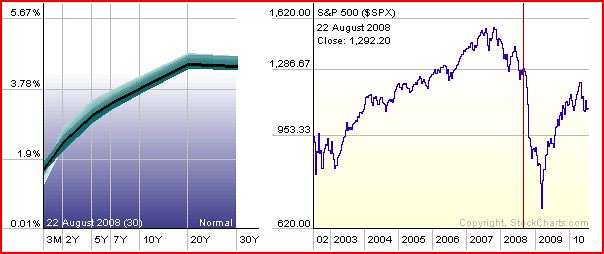
August of 2008: The Bush stimulus in the spring helps with a small upward spike, but the major sell-off continues. Worst of all, as we now know, is many company's borrowed heavily on the way up. With prices falling and investors becoming scarce, they are now strapped for cash. As the old saying goes, "Adventure is the result of bad planning." But dude, check out that good lookin' yield curve!


panic 08
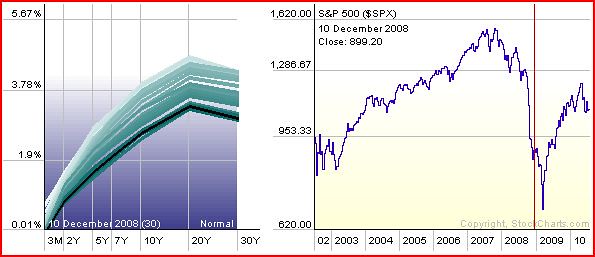
December of 2008: This is what a panic looks like. It's hard to say who's having the greater adventure here, corporate officers, stock market investors or Federal Reserve officials. Interest rates hit zero, and $400 dollars invested in a 3 month Treasury Bill now brings a profit of 1 cent. Even that won't get money back into the stock market.


curve at the bottom
March of 2010: The S&P 500 hits bottom. The stimulus plan was passed in February and together with the government's buying of millions of shares of stock, we have a new meaning to the term "corporate welfare." We might also note that with interest rates at zero, an inverted yield curve is impossible. A flat curve, while theoretically possible, isn't very likely. As a predictive tool, the yield curve is now a meaningless relic. Government manipulation of interest rates is over, for the time being.


curve today
June of 2010: So, here we are today, with the S&P a couple of hundred points above where we started and heading down.

On the political left, there are calls for another round of stimulus and government buying of private debt. This has the unhealthy side effects of ever more federal debt and government ownership of for-profit industry (corporatism). I can't be the only one who noticed that the last round of stimulus did wonders for the stock market while doing nothing for the unemployed; and this from the Party of the Common Man.

On the right are the inevitable calls for tax cuts to "promote growth." Aggregate debt for the S&P alone is over $2.5 Trillion. Are there enough taxes to cut to make up for that much? I don't know, but forget the scissors, better fire up the chainsaw.

All across the political spectrum is a small but growing minority that wants to dump the Federal Reserve altogether. While this won't solve the current dilemma, it might prevent another one. After all, it only took 8 years from the Fed's creation (1913) to the first recession (1921), and 16 years to the first crash (1929). Their record since has been marginally better, but remember, they're supposed to be maintaining stability.

Historically, the stock market is pretty quiet through the summer, and if there is to be another plunge, it would happen in October. Second quarter earnings reports will be released over the next few weeks. We will soon know whether we will have a quiet summer, or an adventurous one; a work stoppage, or more building.

Sunday, July 4, 2010

Masters Of Delusion

I believe that this nation should commit itself to achieving the goal, before this decade is out, of landing a man on the moon and returning him safely to the earth.
John Kennedy

Putting a man on the moon was easy. What people often forget is that doing so without killing him was the hard part. Fooling Mother Nature is always a temporary project. July 20th will mark the 41st anniversary of the greatest trick humanity has ever played on Mother Nature. Like all anniversaries indivisible by 10, it will pass largely unnoticed.

What is being noticed is that the long predicted collapse of the engineered economic order is about to be realized. It’s gotten so bad that even Paul Krugman is noticing. Robert Samuelson, the 2nd smartest guy in economics, is noticing too. Hopefully, the peasantry is noticing that economics is not engineering.

What really got the economists attention was the continuing problems in Greece. In spite of multiple promises of “austerity measures”, and bailouts by a variety of governments and institutions, Greek bond rates are still rising. How can this be? The people with credentials have studied the problem and made their decisions. The policy prescriptions have been put in place, so everything will be ok, right?

As always, there is one thing missing from the equations produced by the would-be Masters of Capital Markets; the peasant class.

I’ve commented many times over the last 2 years about the disappearance of the small investor. (Being a blogger, and therefore one step below a journalist, I’m far too lazy to dig through the archives, so you’ll just have to take my word for it). Disappearance may have been too strong a word, as rising gold and silver prices are a good indication of where he has gone. Precious metal prices are also an indication of the amount of trust in one’s leaders. Like the millions of jobs that became obsolete in the last 2 years, trust shows no sign of making a comeback.

The reasons for this lack of trust are many. The most recent example was nicely demonstrated by Nancy Pelosi when speaking of unemployment checks:

This is one of the biggest stimulus’s to our economy, economists will tell you…it injects demand into the economy…


Even the simplest logic seems to escape both economists and politicians alike. Why not just hand out money to business people and skip the middleman? Oh wait, that was the first and second stimulus. Do you get the impression that if they could nationalize the unemployed, they would? It is one of modern life’s mysteries why so many smart people, who themselves are doing well financially, can’t see the difference between credit and wealth. Perhaps it is because we have been on the Federal Reserve system for so long, they can’t imagine things being any other way.

I know there are some who can’t stand song lyrics in blog posts, but I just can’t resist an old Jethro Tull* favorite.

The excrement bubbles,
The century slime decays,
And the brain-washing government lackey’s
Would have us say,
“It’s under control
And we’ll soon be on our way
To a grand tea for babies
And quiz panel games,
Of the heart-hungry millions
You’ll be sure to remain.”
The natural resources are dwindling
And no-one grows old.
And those with no homes to go to,
Please dig yourselves a hole.

Like the Apollo astronauts preparing for their return, our fate is dependent on the plan made long before. Our current national bank will soon inflate itself out of existence, the same way our country's first three national banks did.

Unlike the astronauts, our plan did not include a safe return, only constant trickery by delusional economic engineers. Our return to earth will not be a joyous occasion. We would do just as well placing our trust in the hands of poets.

*from Wondrin' Again