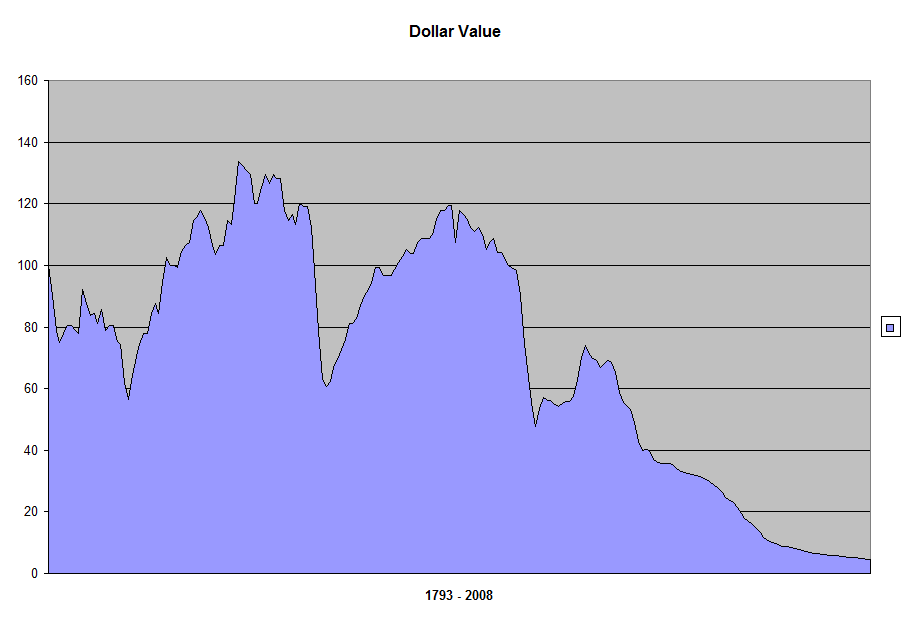
This chart shows the Consumer Price Index (CPI) measured against the value of the 1793 dollar. In other words, if you had earned $100 in 1793, the first year of production for the US Mint, you could have bought $100 worth of stuff. But, if you had saved that money until 1794, how much stuff could you have bought then? What about 1795, 1796, and so on, until 2008.
There are several points of interest in this method that I'll be exploring in more detail later. One hears economists talk of the strength of the dollar today, but this is true only if it is measured against other currencies. It is a subjective value measured on a subjective scale. The year 1793 provides a point of reference for an objective scale. The dollar's value has always been, and will always be, subjective. It's the nature of the beast.


No comments:
Post a Comment