Many of the enhancements we made to the website are backstage and may not meet your eye from the front end: a new computer server, new server software (Win Server 2008), and a major revamp and restructuring of the programming architecture for the entire website...we’ve endeavored to make more explicit the functional characteristics of the menus to help novices better navigate.
Well, I think I qualify as a "novice economist" (who isn't?), so I decided to give it a spin. Just poking around in the introductory analysis on income growth, Dr. Smith's analysis, along with Dr. Tom Harris of UNR's University Center for Economic Development (UCED), shows a rise in property income and transfer payments as indicative of an influx of retirees. So, is Reno turning into a retirement community?
In the "Personal Income by Major Source" section, is a spreadsheet that anyone can use. A menu on the right side of the page offers several choices for different areas. I made the following chart showing Reno/Sparks, using Population Growth as a yardstick to compare with Transfer Payments (social security, medicare, etc.). Transfer Payments also includes sub-categories that are not retirement related, but I'll dig a little deeper later. I also included State/Local government income and non-military Federal income just because the growth of government is my favorite pet peeve.
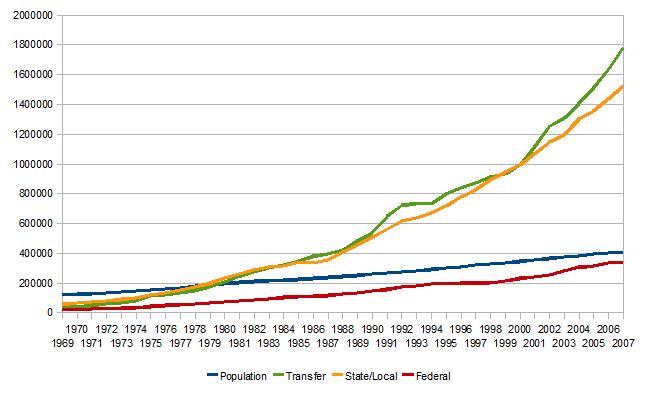
Population shows a steady rise while transfer payments are going through the roof. Income from state and local government workers also shows a sharp increase, which in fairness, could be due as much to the housing situations between Reno and Carson City, as well as other factors. The Feds keep a low profile in line with population.
There are several sub-categories for things, and I had wanted to look at housing a little deeper, but there are just enough years marked "U", for unreported, to make a chart rather meaningless. The Retail Trade category might offer some insight as to how things have been going.
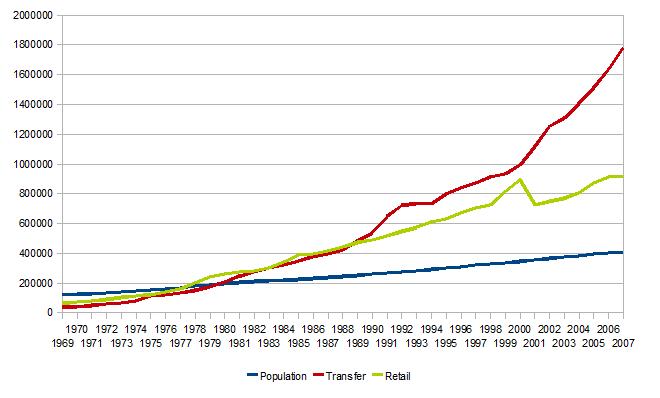
The retail trade looks to have had a mini-boom/bust cycle in the late 90's from which it has never recovered. This is only one small piece of the puzzle, and a bit of an apples to oranges comparison at that, but comparing retail to transfer payments, it's easy to see why our state has a budget problem. The supply of the profit-seeking and productive has been shrinking while the demands of the unprofitable and unproductive has been rising. The so-called "Death of Capitalism" may yet take the welfare state with it.
In any case, Dr's Smith and Harris have been doing yeoman's work gathering and publishing economic data tailored to our area. As I've noted in previous posts, most economists are content to talk to each other. A precious few are willing to take the time and make the effort to educate the general public. This website does seem much easier to use than before. Why that is, is hard to say. There is a more natural progression between the pages, and the menu's are better explained. Like all websites everywhere, it remains a work in progress. This a tremendous asset for any Nevadan interested in the relationships of economic growth and decline.


1 comment:
Fascinating stuff. I just spent a bit of time comparing Washoe county population growth to Clark County population growth. I knew that Clark County had most of the State's people but I was unaware of the difference in growth rates and I was unaware that Clark county has more than 70% of Nevada's population and Washoe county has less than 20% and our percentage is getting smaller
Post a Comment